What is the best time to visit Kathmandu?
October and November are the best months for most visitors. The monsoon has normally ended, rain is low and days are still warm. October is the busiest month of the year, so November is the better pick if you want slightly fewer visitors. Arrivals in November 2025 were still about 116,000, against 128,443 in October.
There’s no perfect month. Winter is dry but has the worst air. Spring is warm but hazy. The monsoon has the cleanest air but the most rain. The rest of this page gives you the numbers to choose for yourself.
What is the weather like each month?
The table below uses World Meteorological Organization (WMO) normals for 1991 to 2020, as reproduced in Wikipedia’s climate table for Kathmandu. They were measured at Tribhuvan International Airport, at 1,337 m. We couldn’t open the WMO record directly, so the citation goes through that table.
| Month | Average high (C) | Average low (C) | Rain (mm) | Rain days | Air quality | National arrivals |
|---|---|---|---|---|---|---|
| January | 19.2 | 2.8 | 15.2 | 1.9 | Often worst | 92,573 (2026) |
| February | 22.1 | 5.3 | 23.6 | 2.6 | Poor | 105,441 (2026) |
| March | 26.0 | 8.8 | 38.0 | 3.9 | Poor, haze building | 120,516 (2026) |
| April | 28.6 | 12.3 | 62.9 | 6.6 | Poor, fire smoke | 107,934 (2026) |
| May | 29.2 | 16.1 | 128.8 | 11.9 | Mixed, fire smoke | 102,626 (2026) |
| June | 29.5 | 19.3 | 241.4 | 16.9 | Improving | 91,363 (2026) |
| July | 28.7 | 20.3 | 384.1 | 23.1 | Cleaner | 71,775 (2026) |
| August | 29.0 | 20.2 | 342.7 | 22.7 | Cleanest | 85,444 (2026) |
| September | 28.6 | 18.8 | 207.8 | 14.6 | Cleaner | 88,248 (2026) |
| October | 27.2 | 13.9 | 43.3 | 3.8 | Fairly good | Over 132,000 (2026) |
| November | 23.6 | 8.4 | 6.4 | 0.5 | Starting to fall | About 116,000 (2025) |
| December | 20.2 | 4.2 | 7.8 | 0.7 | Poor | 98,190 (2025) |
Other climate sources give different numbers. Weather2Travel, which uses data from the Climatic Research Unit and others, shows much more rain in the peak months, about 546 mm for July against the WMO’s 384 mm, and about 79 mm against 43 mm for October. It doesn’t say which years it covers. Use the pattern, not the exact figure.
The air quality column is our plain summary of the sources below. It isn’t a measured monthly average.

When is air quality best and worst?
Air is worst from winter into spring, and cleanest in the monsoon. All the sources we checked show the same broad pattern, even where the figures differ.
- IQAir, 2019: the yearly average for fine particles (PM2.5) was 48 micrograms per cubic metre. The worst month was January at 102.7, December was 75.6, and the cleanest was August at 11.8. IQAir names January to May, November and December as the worst months.
- A 2024 study in the Journal of Nepalese Management Academia: concentrations were high from January to April, and lower from June to August.
- ICIMOD’s Khumaltar monitoring station: it averaged 45 in December 2025, and about 50 from December 2025 to February 2026, and it reached 85 during 9 to 31 January 2026. December 2024 was nearly 1.5 times higher, according to The Diplomat Nepal’s report of ICIMOD data.
- Worst days: the Kathmandu Post reported PM2.5 of 340 at Pulchowk in January 2026, based on IQAir data. Single-site readings like this one run far higher than monthly averages.
For scale, a study in ACS Earth and Space Chemistry notes that the World Health Organization’s 24-hour guideline is 15 micrograms per cubic metre. Spring adds forest fires. The forest fire expert Bhola Bhattarai told the Kathmandu Post that the fire season peaks in April and May, and The Himalayan Times reported an AQI of 348, in the hazardous band, in spring 2025.
If you have asthma or heart or lung problems, this should weigh more than any other factor here. Check a live reading before you plan a long outdoor day.
When can you see the mountains?
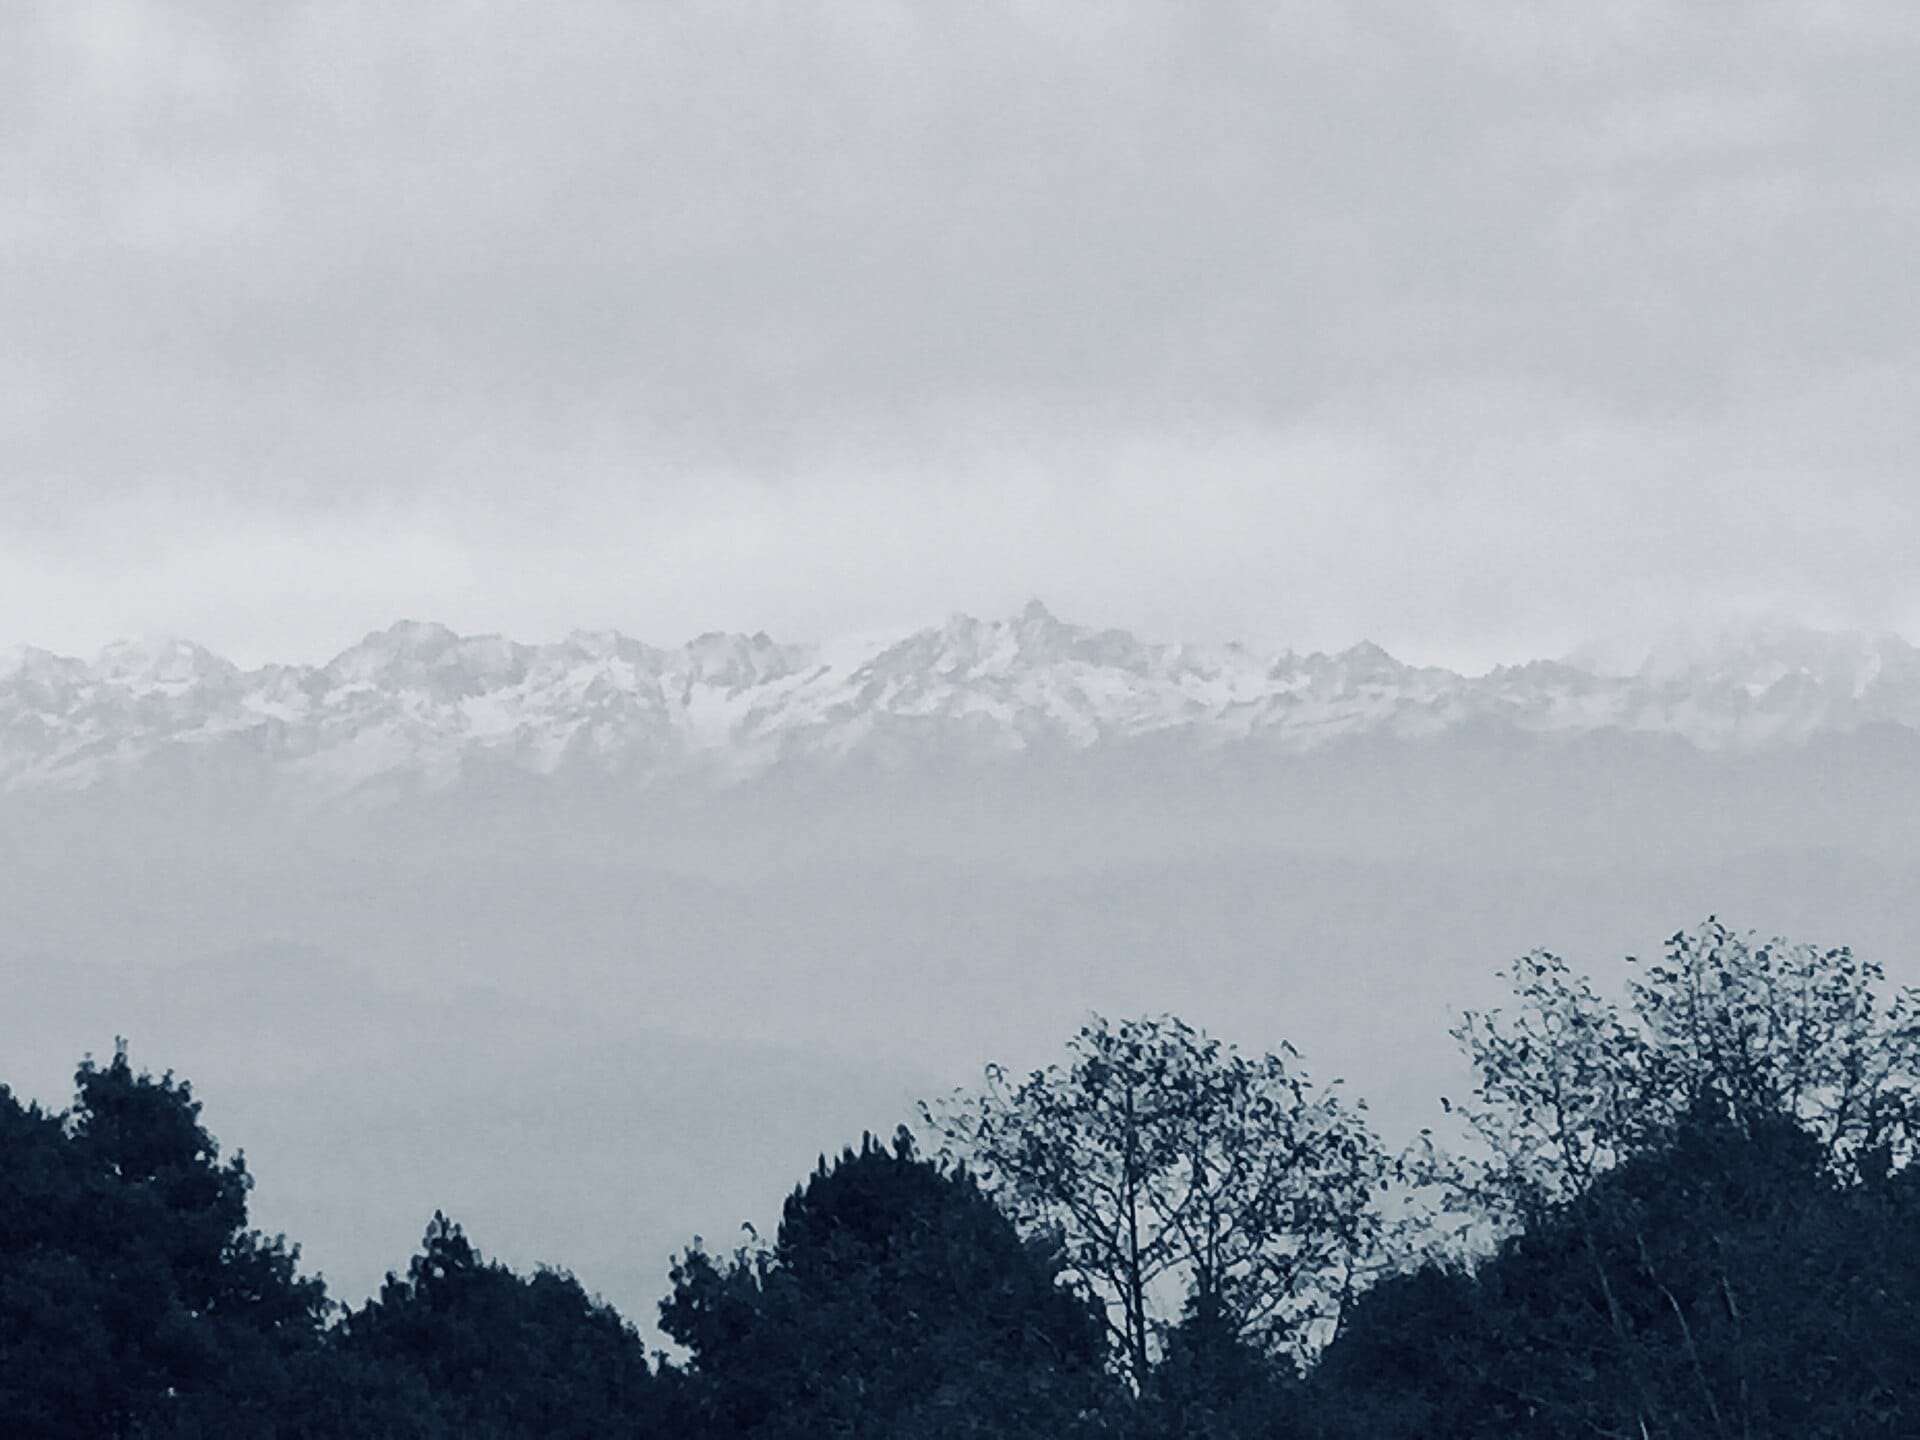
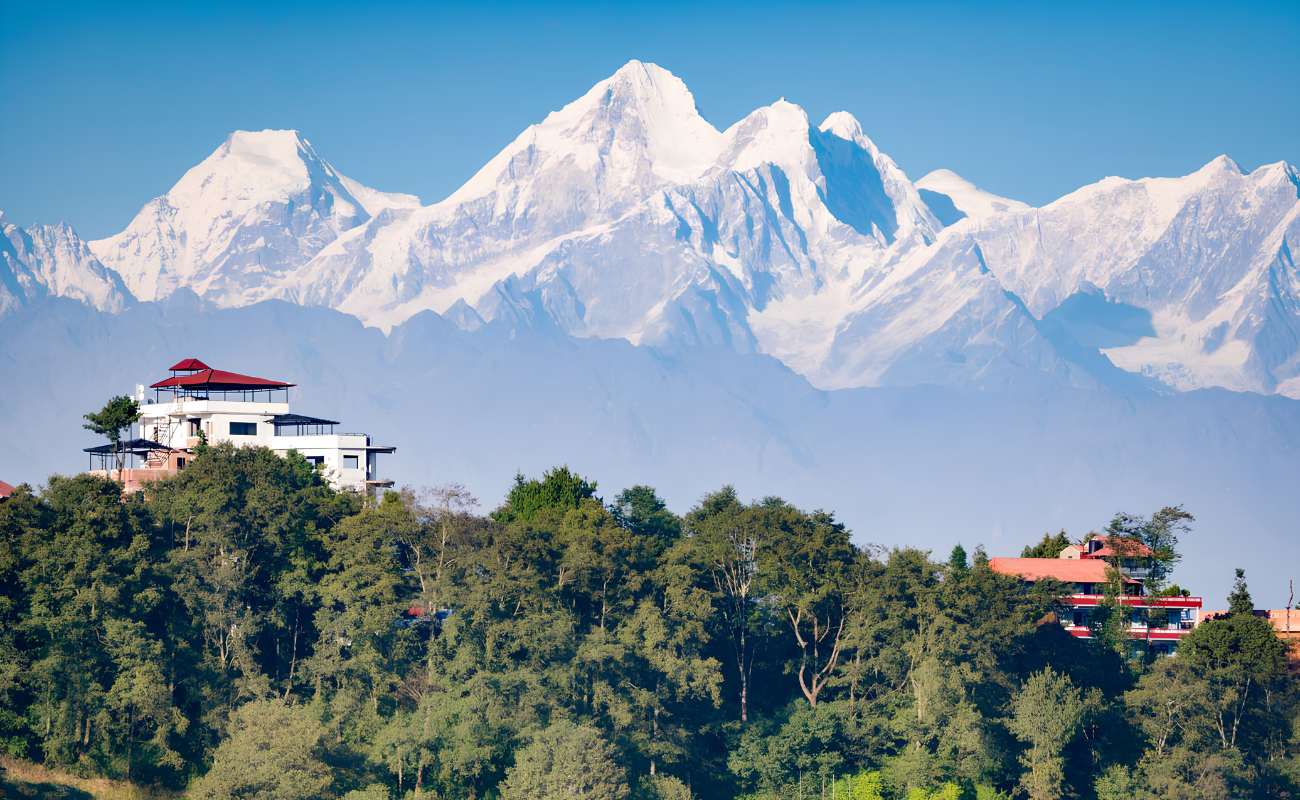
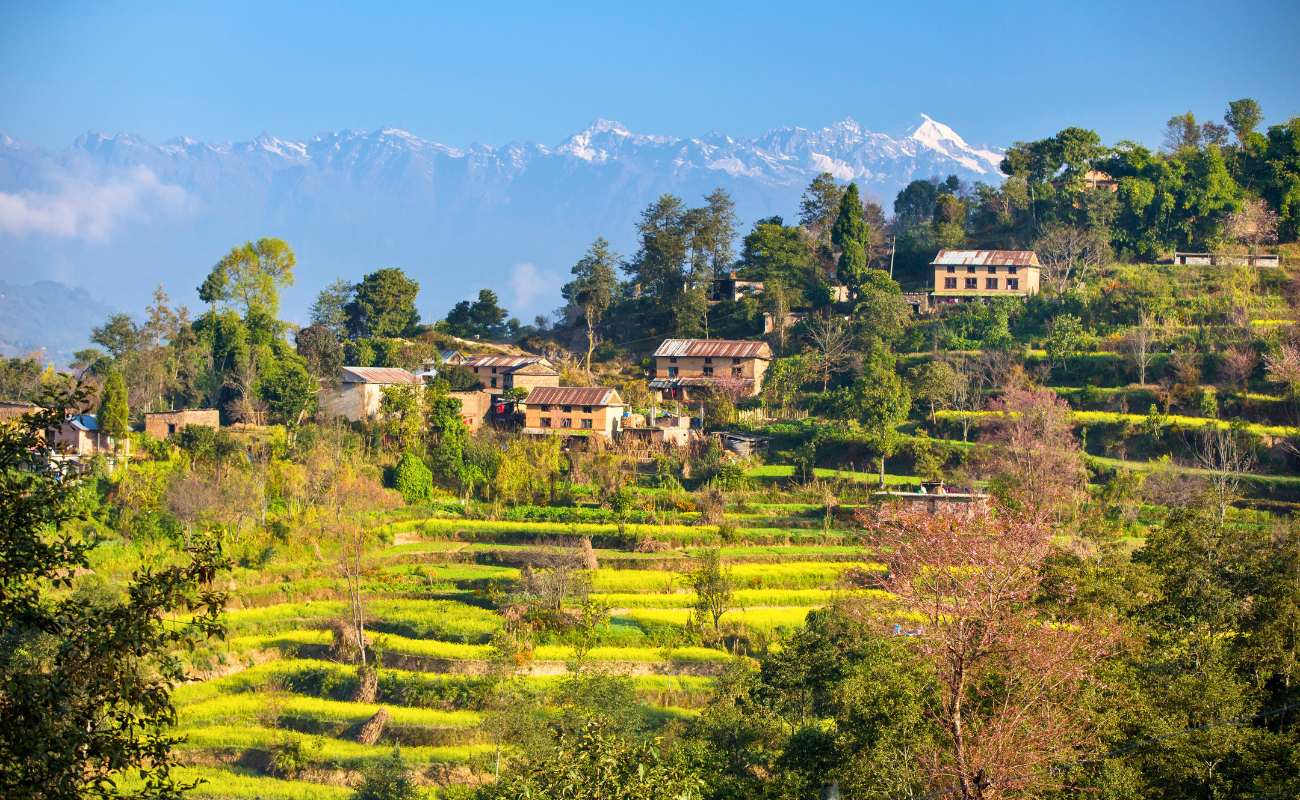
Mountain views are never guaranteed, but October and November give you the best chance. In Your Pocket says clear skies at Nagarkot are most likely in those two months. Monsoon cloud and winter haze both hide the peaks.

Which months are busiest?
October and March are the two peaks, based on national arrivals. We couldn’t find visitor counts for Kathmandu alone, so these figures cover the whole country. The Himalayan Times links October’s peak to the autumn trekking and mountaineering season, so not every arrival is a Kathmandu sightseer.
- 2025: October had 128,443 arrivals, March had 121,687 and April had 116,490, according to The Himalayan Times, citing the Nepal Tourism Board. The total was 1,158,459.
- 2026: Kantipur reported more than 132,000 arrivals in October, the highest month so far that year. The monthly figures in the table for January to September are from The Rising Nepal, which gives a nine-month total of 865,920.
July was the quietest month in the 2026 figures. Arrivals can also fall sharply for other reasons. September 2025 dropped to 78,711 after the Gen Z protests that month.
What is each season like?
Each season suits a different kind of visit. This summary is our reading of the numbers above.
| Season | Good | Not so good | Suits |
|---|---|---|---|
| Autumn, October and November | Dry days, best views, warm afternoons | Crowds and higher demand, especially October | First-time visitors, photographers |
| Winter, December to February | Very little rain, fewer arrivals than the peaks | Worst air, cold mornings and nights | Travellers without lung problems |
| Spring, March to May | Warm days | Haze and fire smoke, busy in March and April | People combining a spring trek |
| Monsoon, June to September | Cleanest air, fewer visitors | Heavy showers, few mountain views, travel delays | Travellers who are flexible and don’t mind rain |
The monsoon’s normal end date is 2 October, but The Himalayan Times reported 14 October in 2026. The UK Foreign Office warns that monsoon flooding and landslides can make roads impassable, so leave spare time if you’re travelling beyond the valley then.

When are the main festivals?
Festival dates follow the lunar calendar, so they move each year. These dates come from the Ministry of Home Affairs list for Nepali year 2083, as reproduced by Pradhan and Associates. It runs to 13 April 2027, and Bisket Jatra wasn’t on it as a separate entry.
| Festival | Date | Applies to |
|---|---|---|
| Tihar public holidays | 8 to 12 November 2026 | National holiday. The festival days run 7 to 11 November, according to Hamro Patro |
| Yomari Punhi | 24 December 2026 | National holiday |
| Sonam Lhosar | 7 February 2027 | National holiday |
| Shivaratri | 6 March 2027 | National holiday |
| Gyalpo Losar | 9 March 2027 | National holiday |
| Holi (hill districts) | 21 March 2027 | 56 districts |
| Ghode Jatra | 6 April 2027 | Kathmandu Valley only |
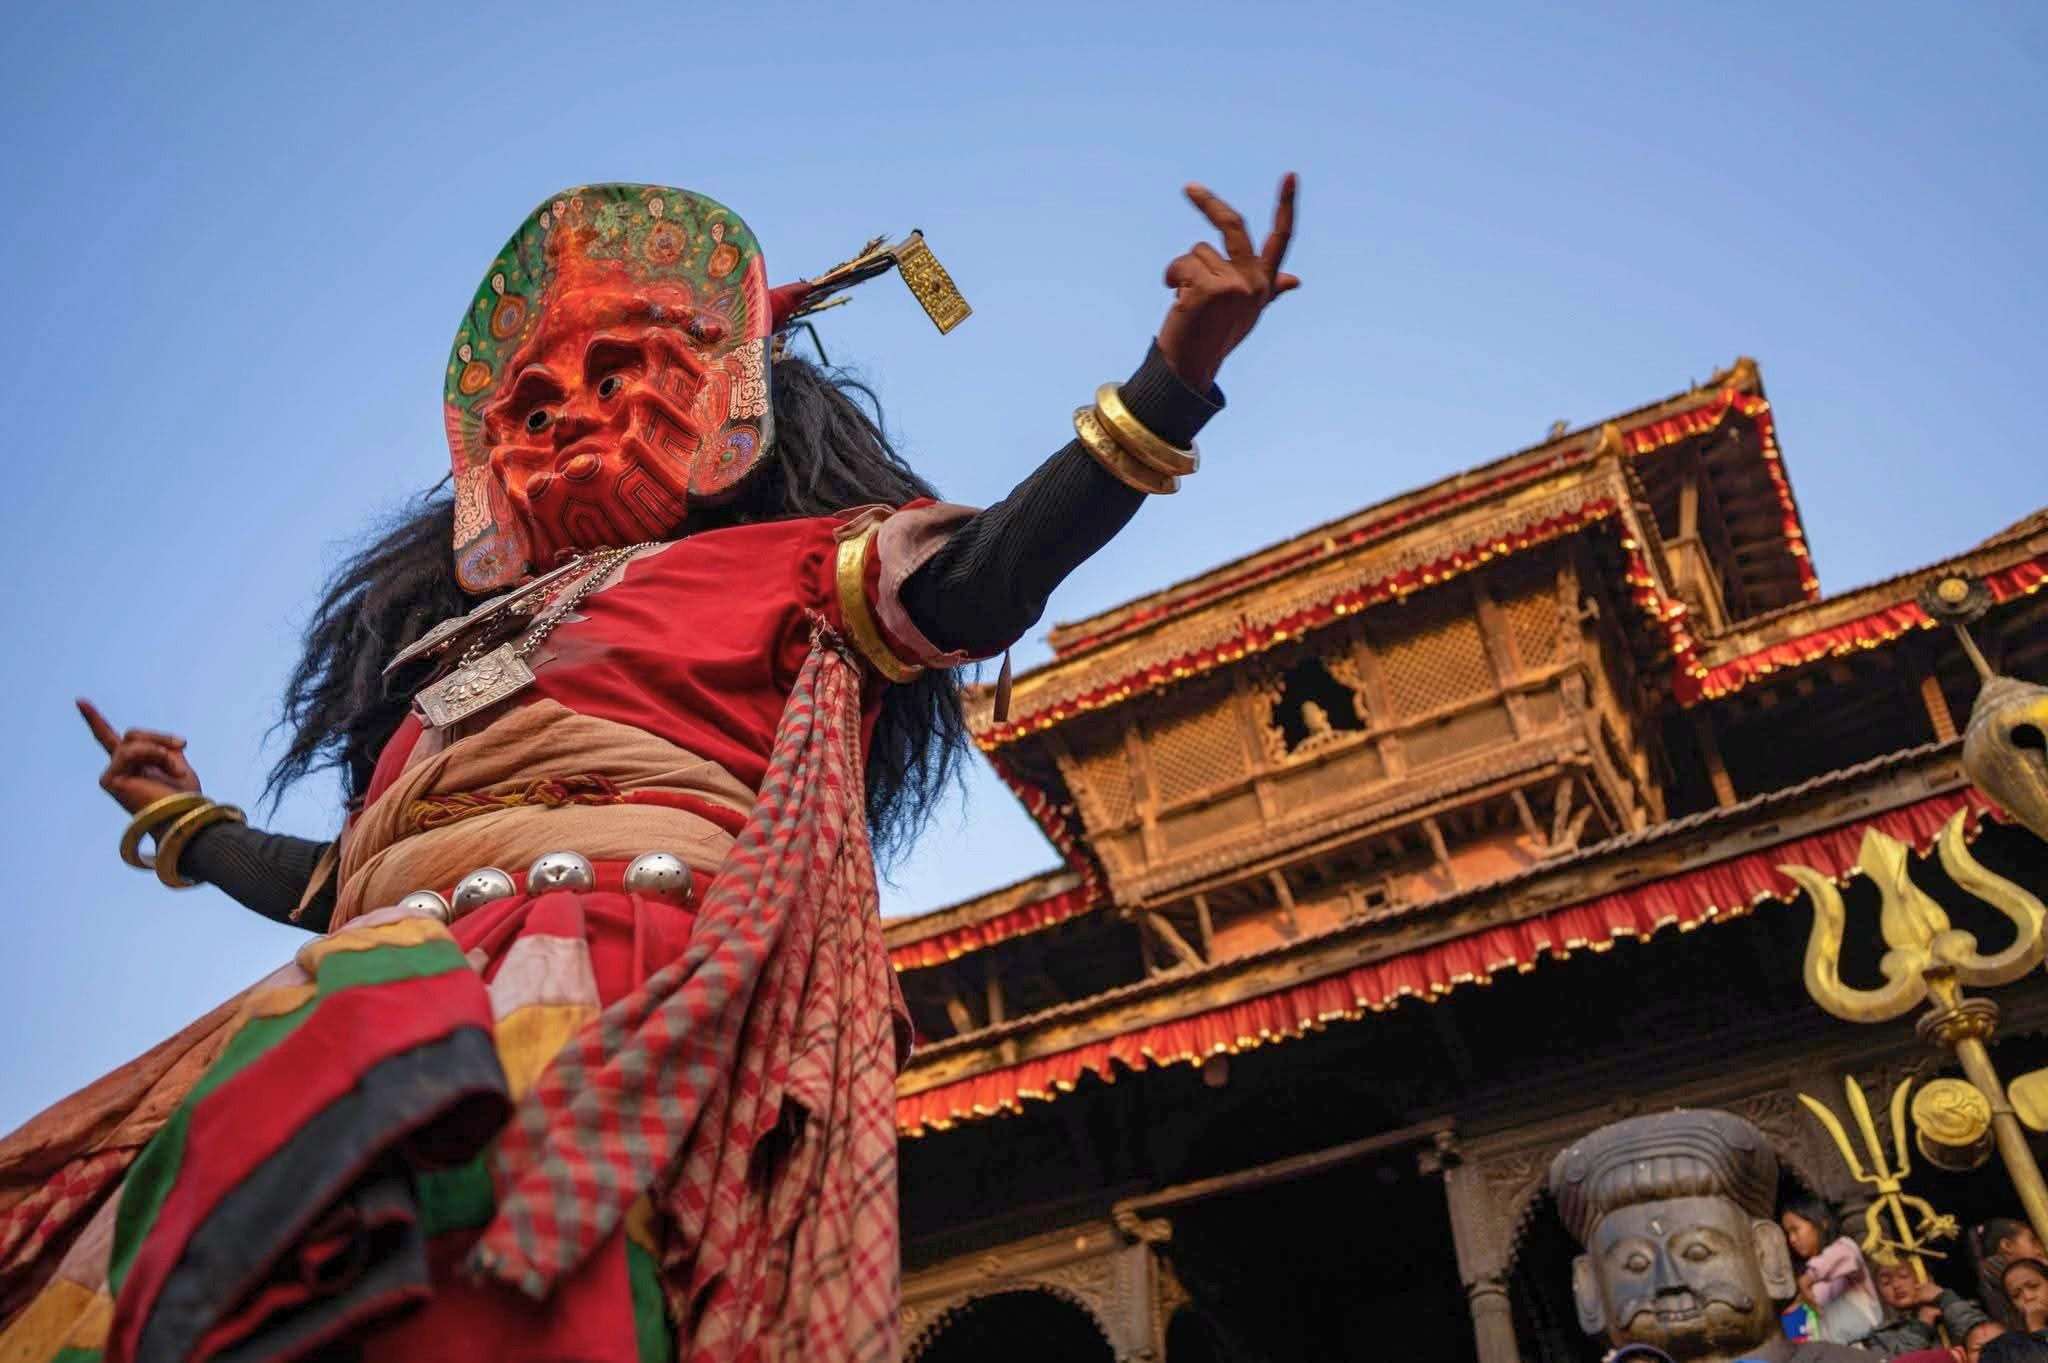
Later dates aren’t published in the list we could read, so here are the 2026 dates as a guide to the season: Buddha Jayanti on 1 May and Indra Jatra on 25 September. Dashain began on 11 October, with public holidays from 17 to 23 October. Expect them to move in 2027.
Festivals can be the highlight of a trip, but they bring crowds and closures. Add a spare day if you’re travelling around one.
How should the season change your plans?
Change your start time and your order of sites, more than your destination. Most of the valley works year-round.
- Monsoon: go early and plan on afternoon showers. Keep a museum as a backup.
- Winter: start after the early cold if you’re not chasing sunrise, and bring layers. See what to wear in Kathmandu.
- Spring: check air quality in the morning, and don’t pay extra for a mountain view if the haze is thick.
- Autumn: ask about dates early if you want a guide or a car in October, as this is the busiest month.
If you’re still weighing the trip itself, read is Kathmandu worth visiting for the case against as well as the case for.